So first of all I wanted to title it as “Time series Data and All the complexities it comes with, plus some solutions to deal with it!” The need of that title was because we know the field of data science but if you are here, then I believe you are new to time series data, so I want you all to consider time series data as a new entity placed in our already existing environment of data science and analysis. Just like COVID-19 (a new entity) when introduced to our world (already existing environment) it brought some complexities with itself, similar is the case with time series data but nevermind, now when I have that out of my chest let’s move on to understanding our topic better. I feel that everything introduced to an already existing environment is for some economic or fame-based benefit and I feel the same about time series data, someone must have thought about the importance of understanding the abundance of sequential data and here you are reading my boring article to deal with all the complexities it comes with. So without wasting more time, let’s dig in.
Let’s start with most probably a plagiarized or a wrong or probable both definition of Time Series Data:
Time series data, also referred to as time-stamped data, is a sequence of data points indexed in time order. Time-stamped data is collected at different points in time.
I don’t agree with what I wrote above cause it is not just about data being collected in a sequential time order, according to that, everything can be a time series data, so let’s correct it a bit. Time can be one of the columns of the dataset, without data being a Time Series Data. It is only a Time Series Data when the Time interval is adding a meaning to the data. So taking a quick example for better understanding, suppose we are working over two non-invasive brain experiments, one is through brain imaging technology of MRI scans and other one is EEG scans. We have two categories of data, one of the patients and another of healthy controls (HC). Suppose while doing MRI scans, I did MRI scan of all the patients on Thursdays only and of all the healthy controls on Saturdays only, and while creating a supervised model to detect who is patient and who is not, I used the metadata having dates of MRI Scan too, by going through the dates my model will adapt to a bias and will probably understand that all the Scans happened on Thursday are of Patients and all on Saturday are of HC, which obviously is a wrong assumption. So in this case time probably is one of the columns of the database but instead of adding any meaning to the data it is just adding a false pattern, so obviously it isn’t a case of time series data and apart from that column of date should most probably be dropped for better model training. Coming on to the EEG experiment, let’s suppose we again have 2 subjects one is a patient and other is a HC and we are making them watch the same movie scene and are recording their EEG to understand how their brain reacts, if we will be having only the signal of both the patients individually it won’t be meaningful to draw any conclusion out of it but only when we will put both the signals over the same time frame, we will be able to compare both of them and will be able to understand the different reactions of different brains while watching the same scene.
Thus EEG data is a Time Series data, as when we are looking at it through the perspective of time it is adding some useful meaning to the data. Now that it is clear, there are many other examples of time series data like share market data, cryptocurrency data, EEG, ECG, Daily Temperature, Change in Human Population and so much more.
One other aspect of Time Series data is Historic Relevance. Now obviously if some data is sequential, what makes it different from other sorts of data is that each point of data is related to the point of data previous to that on the axis of time. And it is this phenomenon only which we call historic relevance. While analyzing data, we harness this property of historic relevance only to understand or derive the pattern out of the data and we use this to predict the future data points too. If we take a pretty simple example to understand this.
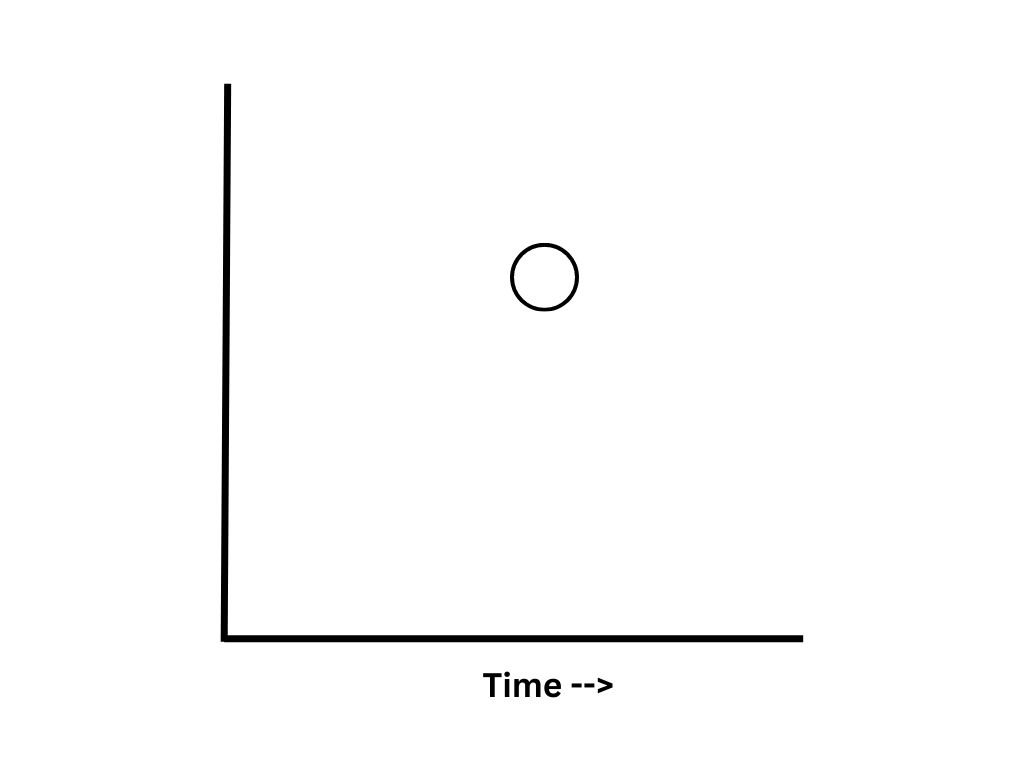
Fig 1: A ball at a single time frame
In the above image you can see a ball at some random interval of time, with this particular data point you can’t get any idea about the trajectory of the ball, while in the above image you are given with few past data points too and you can see that with the increase in the time the ball is moving in the particular direction and with that things makes a little more sense now, we still can’t be precise about what will be the exact coordinates of the ball in the next time interval but we got a basic idea which is enough to make a nearly accurate prediction. If we look from this way this is all what stock analysis is about. We observe the previous data points on the axis of time and then try to make a roughly accurate prediction, I feel like now it will be clear to you that it all is because of historic relevance.

Fig 2: A single ball at progressing time scale(s)
If you search for time series data, you can probably find data being immutable and appended only, being two features of time series data. Though I don’t completely agree with that. Immutable to start with, means something which can’t be changed. On the other hand, appended only means that you can only append the new data points at the end of the dataset only and can’t just put something in between. Now considering time series data being taken over the axis of time, obviously if once the time has passed away you can’t change the event which makes it immutable and also as time’s arrow only marches forward it is again logical to think that you can only append the new data points at the end of the database and not just put it somewhere in the middle but, the time on which some events occur and the time on which you collect the data of those events can or can not be same and on the basis of that the properties like immutability and appended only changes. If you are thinking, “What the HELL he is talking about!” Let me elaborate with 2 examples. Consider your stock market data, the data is continuously generating, and suppose you have an API continuously fetching it for you, in this case once the event is done, and you have the data you can’t change it and obviously all the new data points will be added at the end, so yeah the database is immutable and appended only but let us take another wild example about the discovery of human evolution, it is also a time series data as looking it over the time we are able to derive so many things about adaptations and exaptations. But the fossils we collected over the time were not found in sequence so we did find the data points in an unarranged pattern and to look it over the time axis we had to lose the property of immutability and appended only.
Time series data can be divided into two types too. So let’s just rush through them. The data can be regular or irregular. Regular or Metrics Time series data means nothing but that we collected the data on regular time intervals, for example I wrote down the temperature of my city everyday for 365 days then that data as collected at a regular interval (one day) is thus regular time series data. Then we have Events or Irregular Time series data, which as the name suggests is collected over irregular time intervals but why? Because we are creating the database by noting down some specific events, which may or may not happen in regular time intervals, for example if I start noting down the dates whenever an earthquake strikes my country, obviously it won’t and SHOULDN’T happen on regular time intervals, thus irregular time series data.
Something very similar to time series data is panel data and many times both the types are taken as one of the same thing, which I personally don’t mind. But obviously, nomenclature doesn’t work like that so let’s understand what this all is. Before reaching panel data though, we have to understand Cross Sectional Data so let’s understand all of it with one example. We already know that if I am collecting the maximum temperature of my city everyday then the data that I have is Time Series Data. Suppose for one day I was going from my city to another city, on that day I collected the maximum temperature for both the cities, so for that PARTICULAR day, my data is called cross sectional data. Panel Data is nothing but addition of both the time series and cross sectional data. So if I collected the maximum temperature of both the cities everyday for 365 days then it is Panel Data. Pretty stupid, but it is what it is.
To be Continued…